Just as the labyrinth of train tracks intricately connects the bustling stations across geographic areas, relationships in graph databases serve to connect nodes in a complex yet orderly web of data. The Berlin subway system, with its complexity and efficiency, serves as a captivating analogy and an ideal introduction to the world of graphs.
Getting the Data on the Berlin Subway
I gathered data on subway stations and lines in CSV files. The berlin-stations.csv file contains information about each subway station, including its name, latitude, longitude, and a flag indicating if it’s an end station. The berlin-lines.csv file describes the connections between stations, the subway line they belong to, and the travel time.
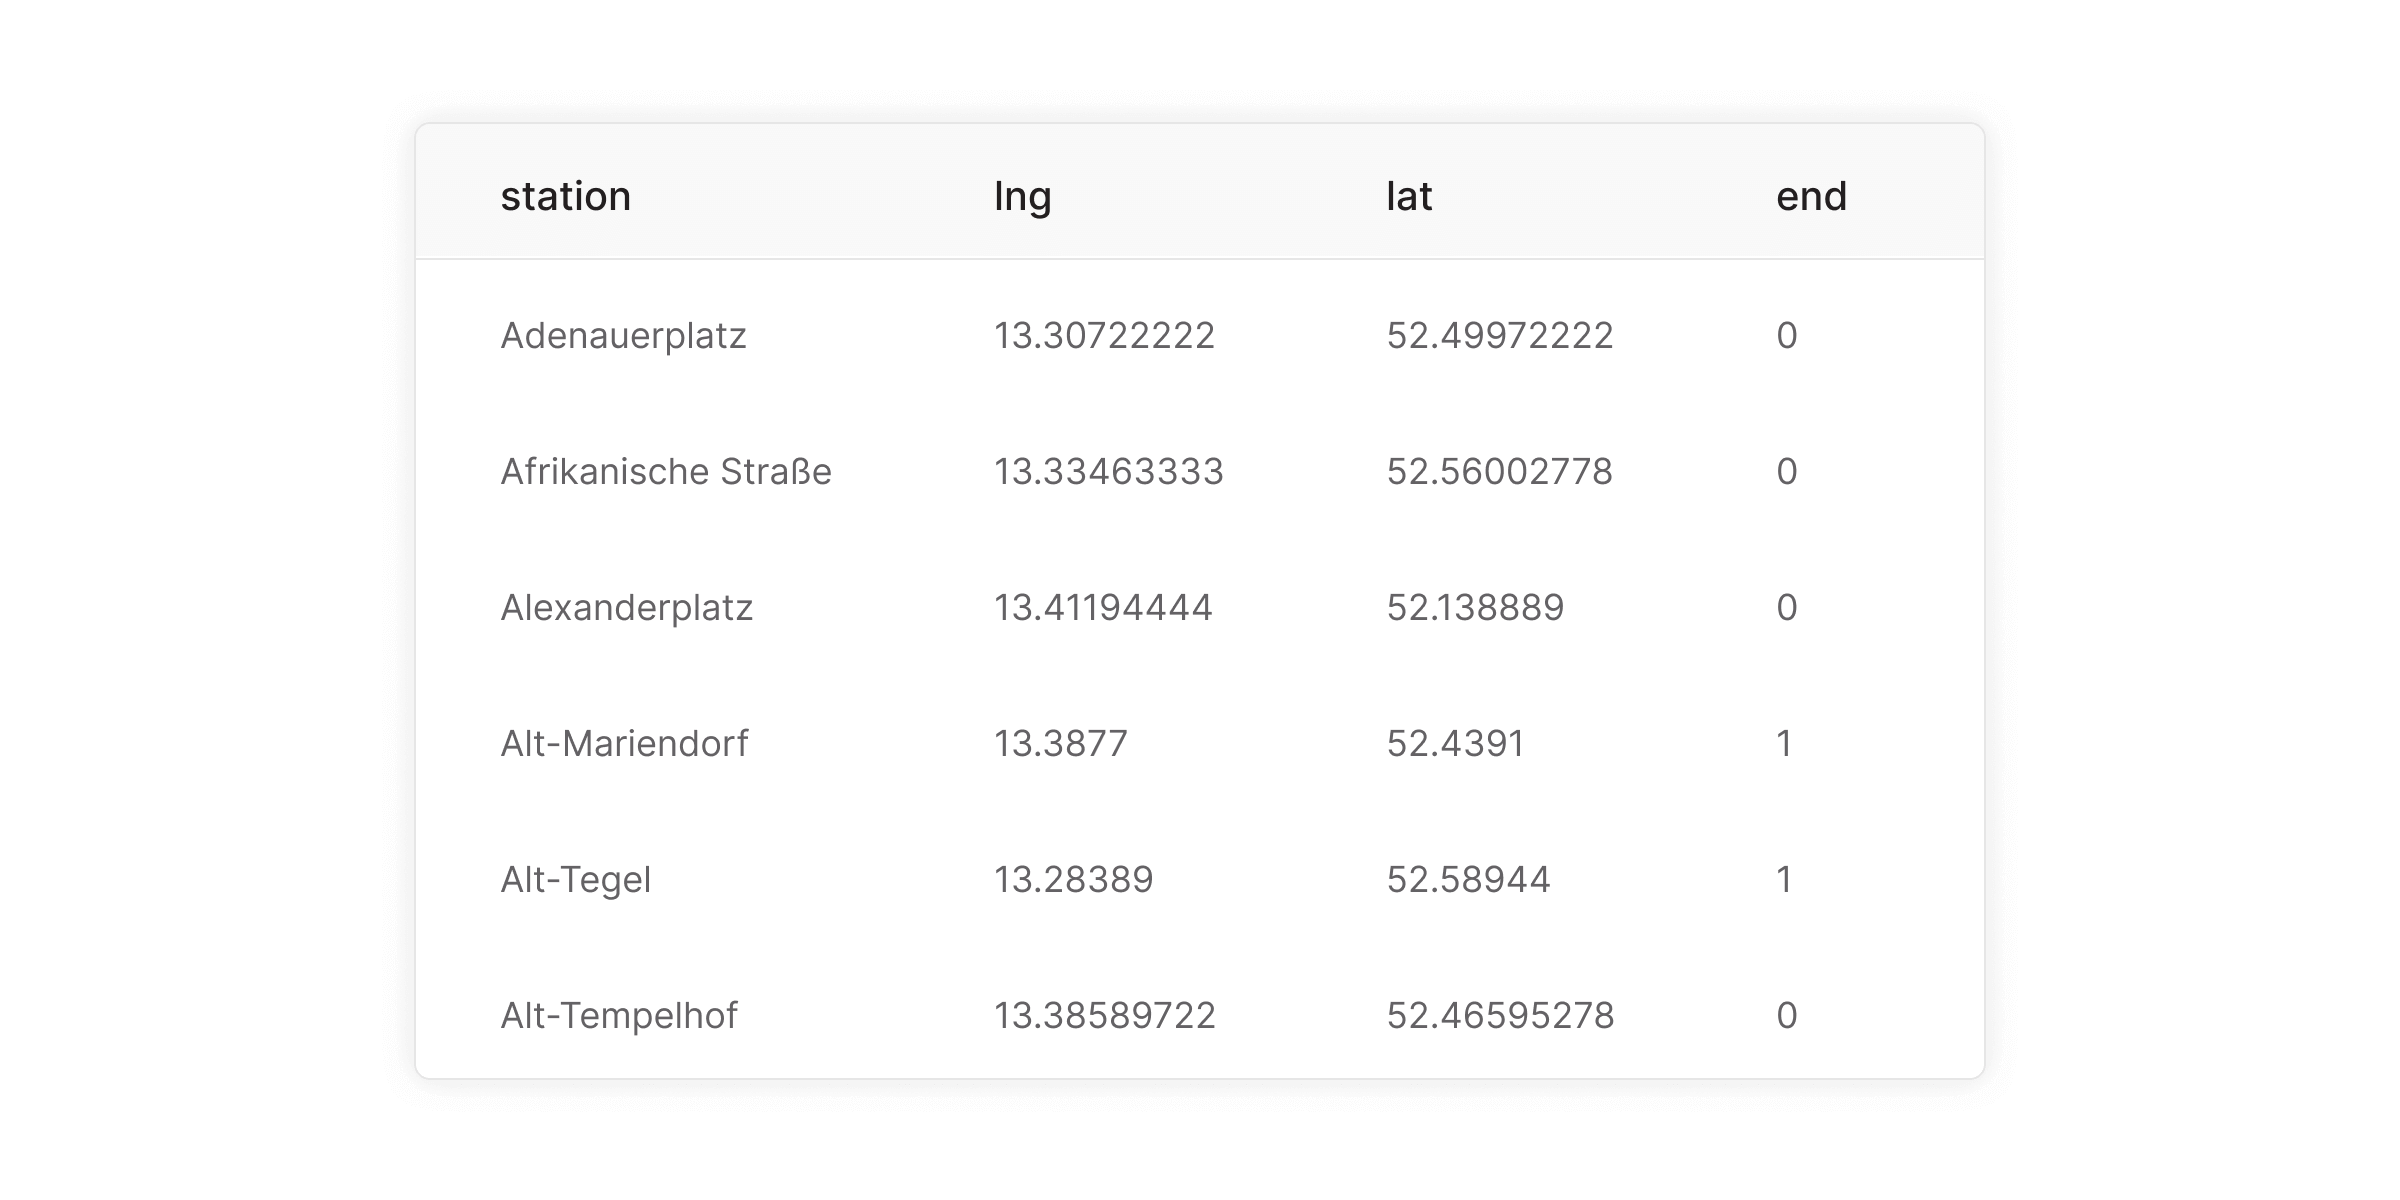
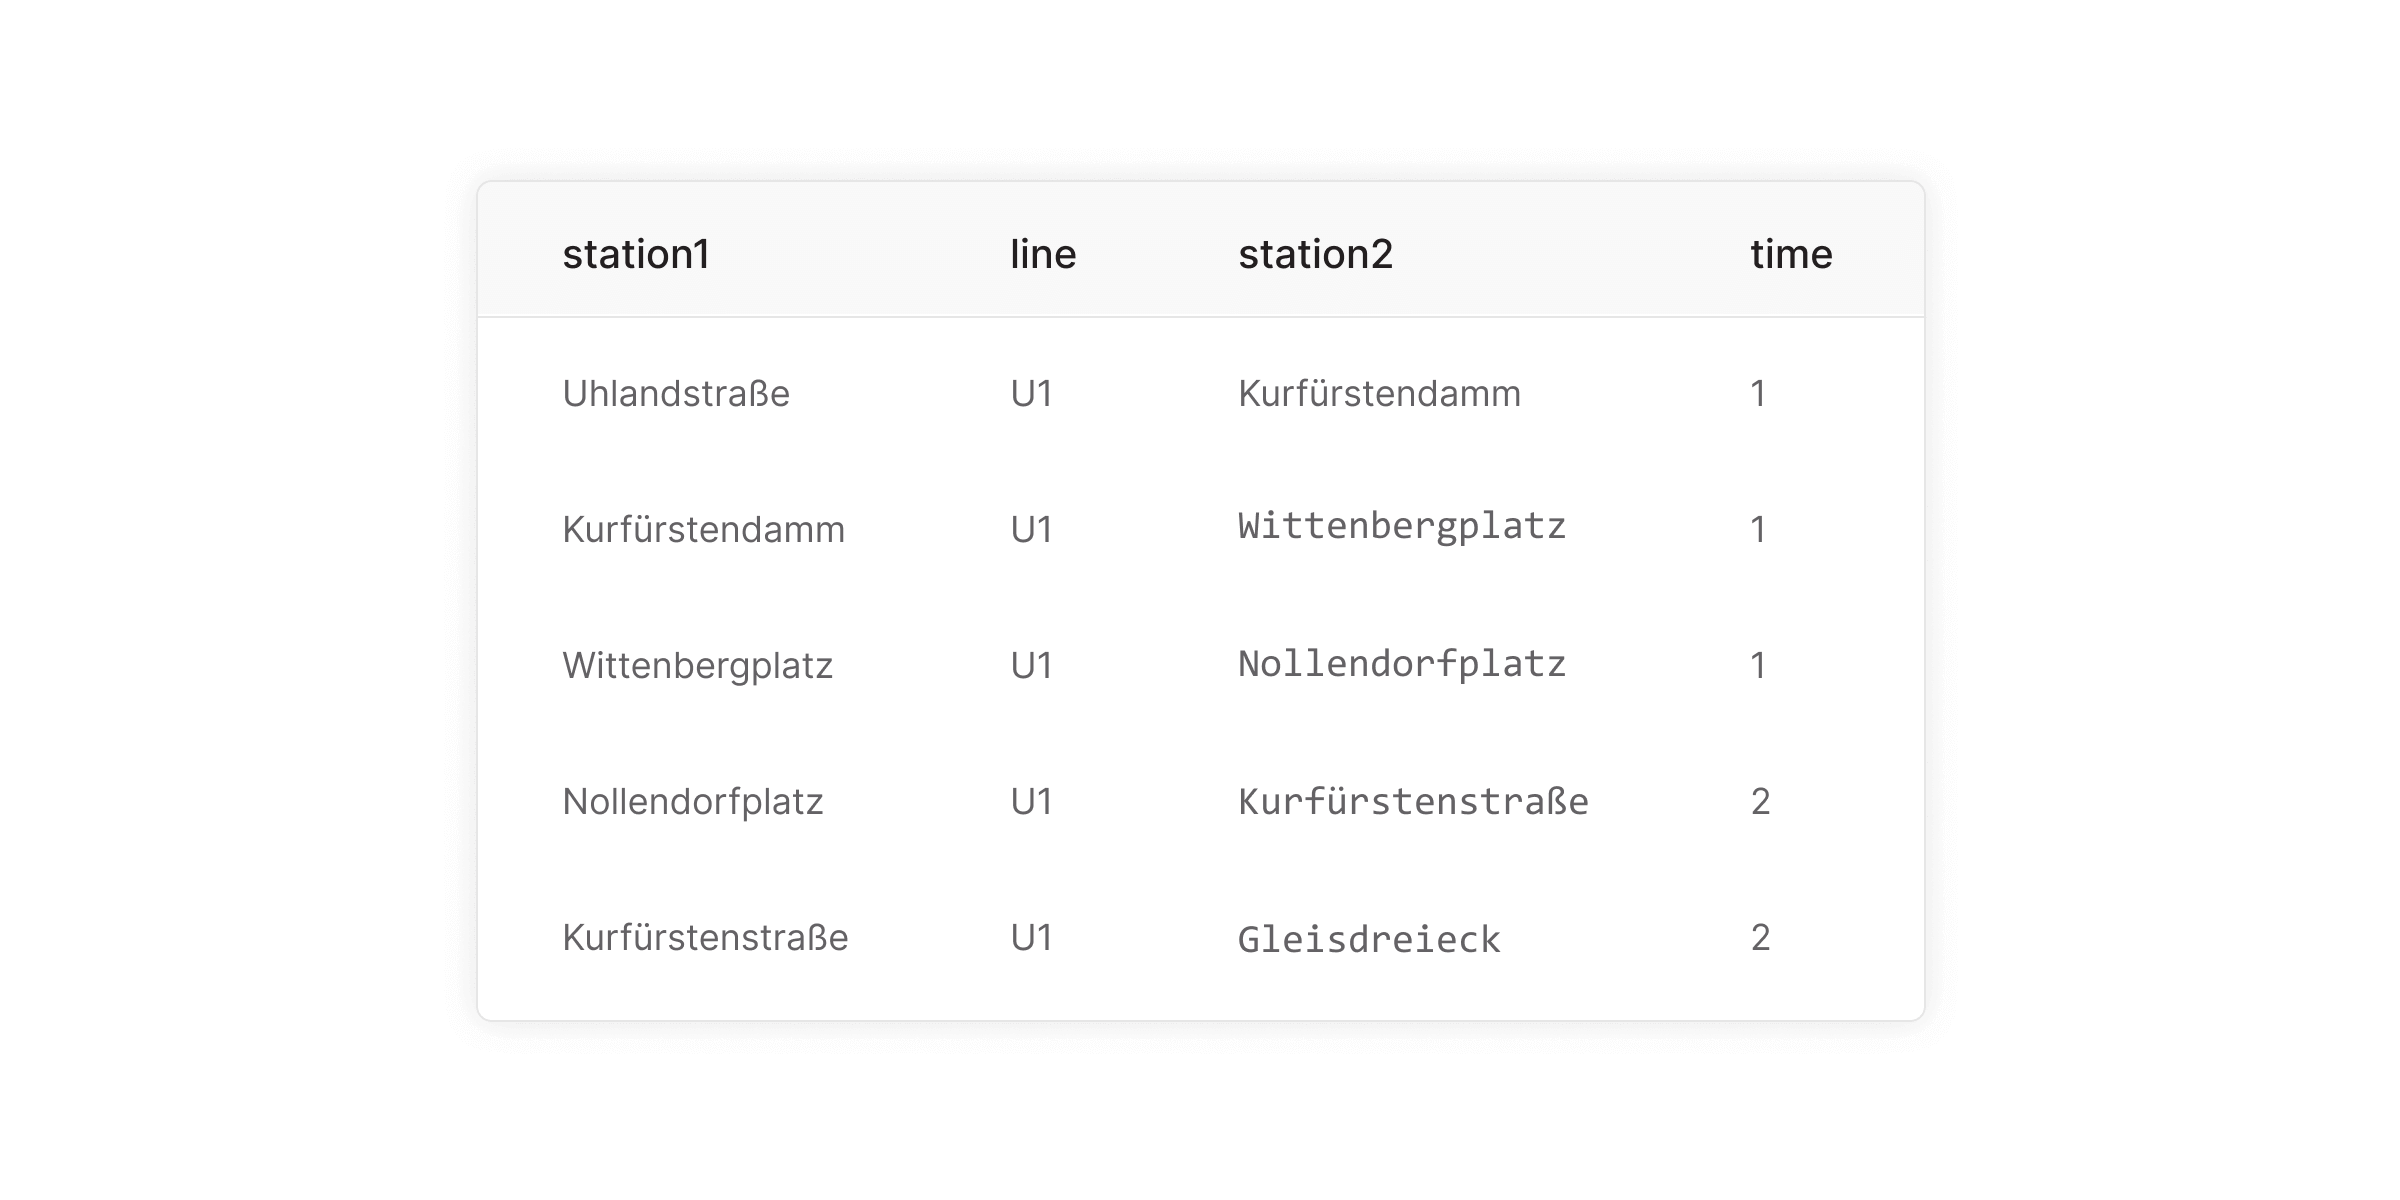
The CSV files are available here:
Setting Up Memgraph
Pull the latest version of Memgraph Platform:
docker run -ti -p 3000:3000 -p 7687:7687 -p 7444:7444 --name berlin-subway memgraph/memgraph-platform:latestImporting the Data
To load the data directly from Memgraph’s website:
LOAD CSV FROM "https://public-assets.memgraph.com/berlin-subway/berlin-stations.csv" WITH HEADER AS row
CREATE (n:Station {name: row.station, lat: toFloat(row.lat), lng: toFloat(row.lng), end: toInteger(row.end)});

LOAD CSV FROM "https://public-assets.memgraph.com/berlin-subway/berlin-lines.csv" WITH HEADER AS row
MATCH (s1:Station {name: row.station1}), (s2:Station {name: row.station2})
CREATE (s1)-[:CONNECTED_VIA {line: row.line, time: ToInteger(row.time)}]->(s2);
If you downloaded the files locally, copy them to your Docker container first:
docker cp berlin-stations.csv berlin-subway:/usr/lib/memgraph/berlin-stations.csv
docker cp berlin-lines.csv berlin-subway:/usr/lib/memgraph/berlin-lines.csv
Then load them from the local path:
LOAD CSV FROM "/usr/lib/memgraph/berlin-stations.csv" WITH HEADER AS row
CREATE (n:Station {name: row.station, lat: toFloat(row.lat), lng: toFloat(row.lng), end: toInteger(row.end)});

LOAD CSV FROM "/usr/lib/memgraph/berlin-lines.csv" WITH HEADER AS row
MATCH (s1:Station {name: row.station1}), (s2:Station {name: row.station2})
CREATE (s1)-[:CONNECTED_VIA {line: row.line, time: ToInteger(row.time)}]->(s2);
Visualize Data in Memgraph Lab
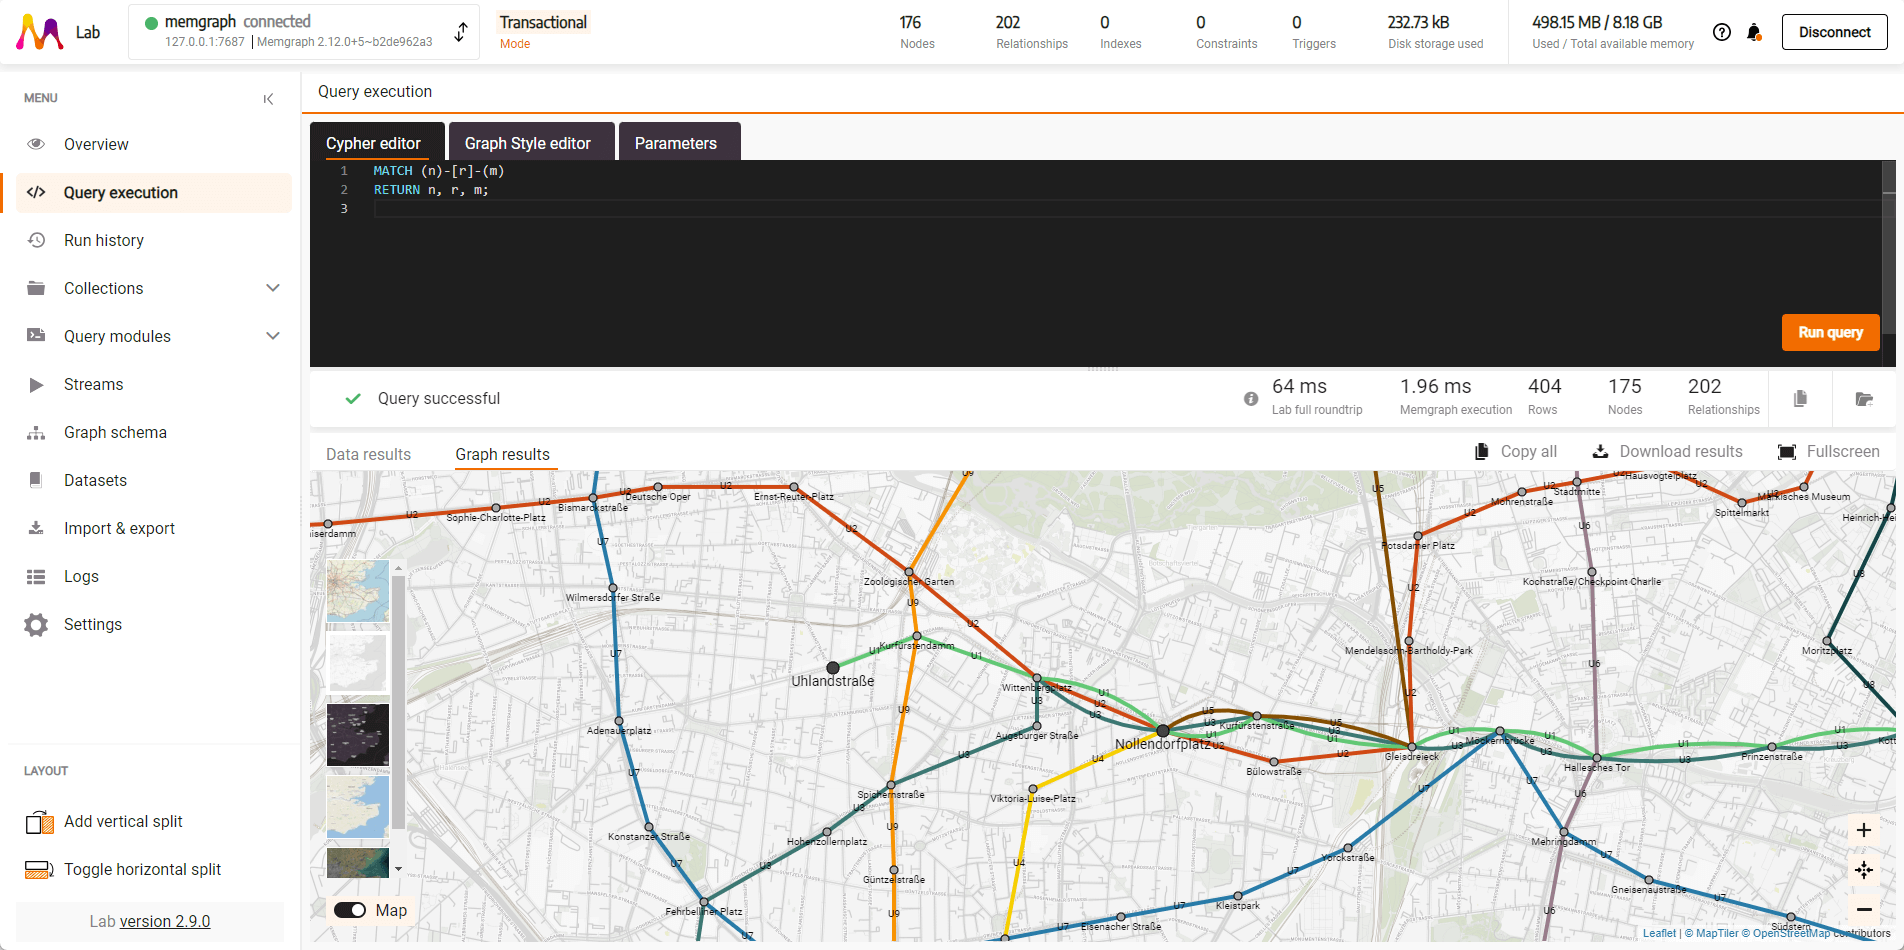
To see all stations and lines:
MATCH (n)-[r]-(m)
RETURN n, r, m;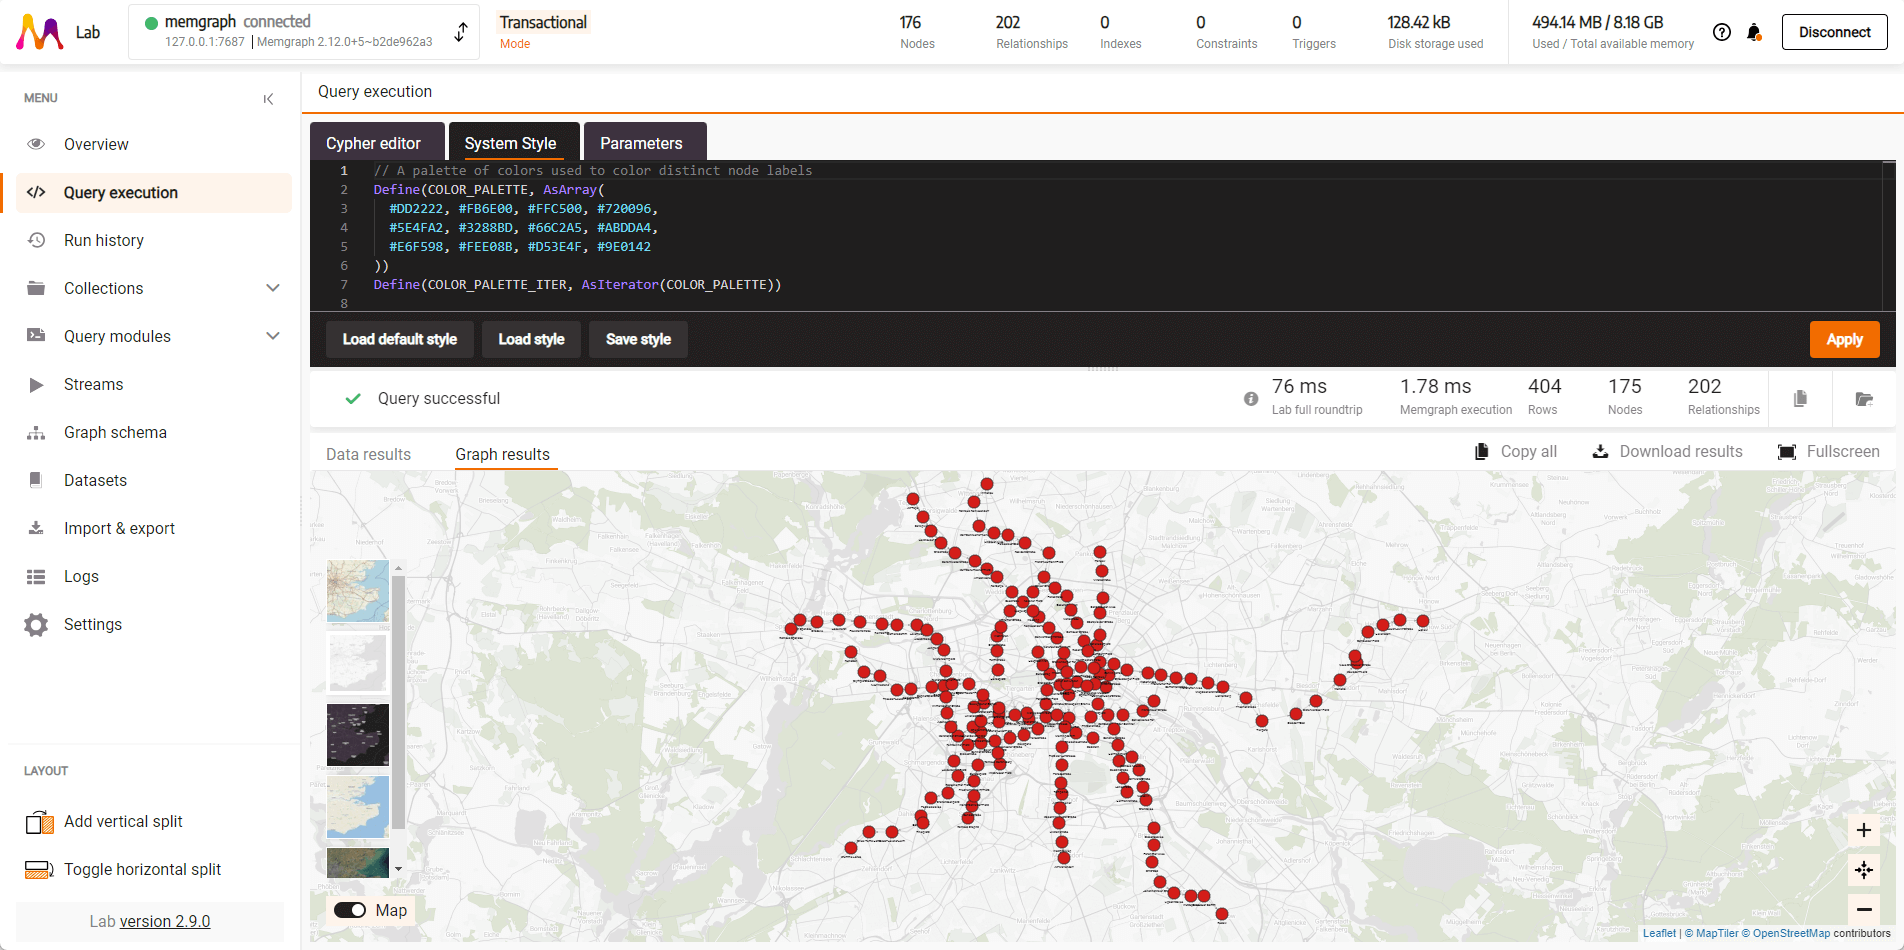
To see only one subway line, for example U1:
MATCH path = (s1:Station)-[r:CONNECTED_VIA {line: 'U1'}]->(s2:Station) RETURN path;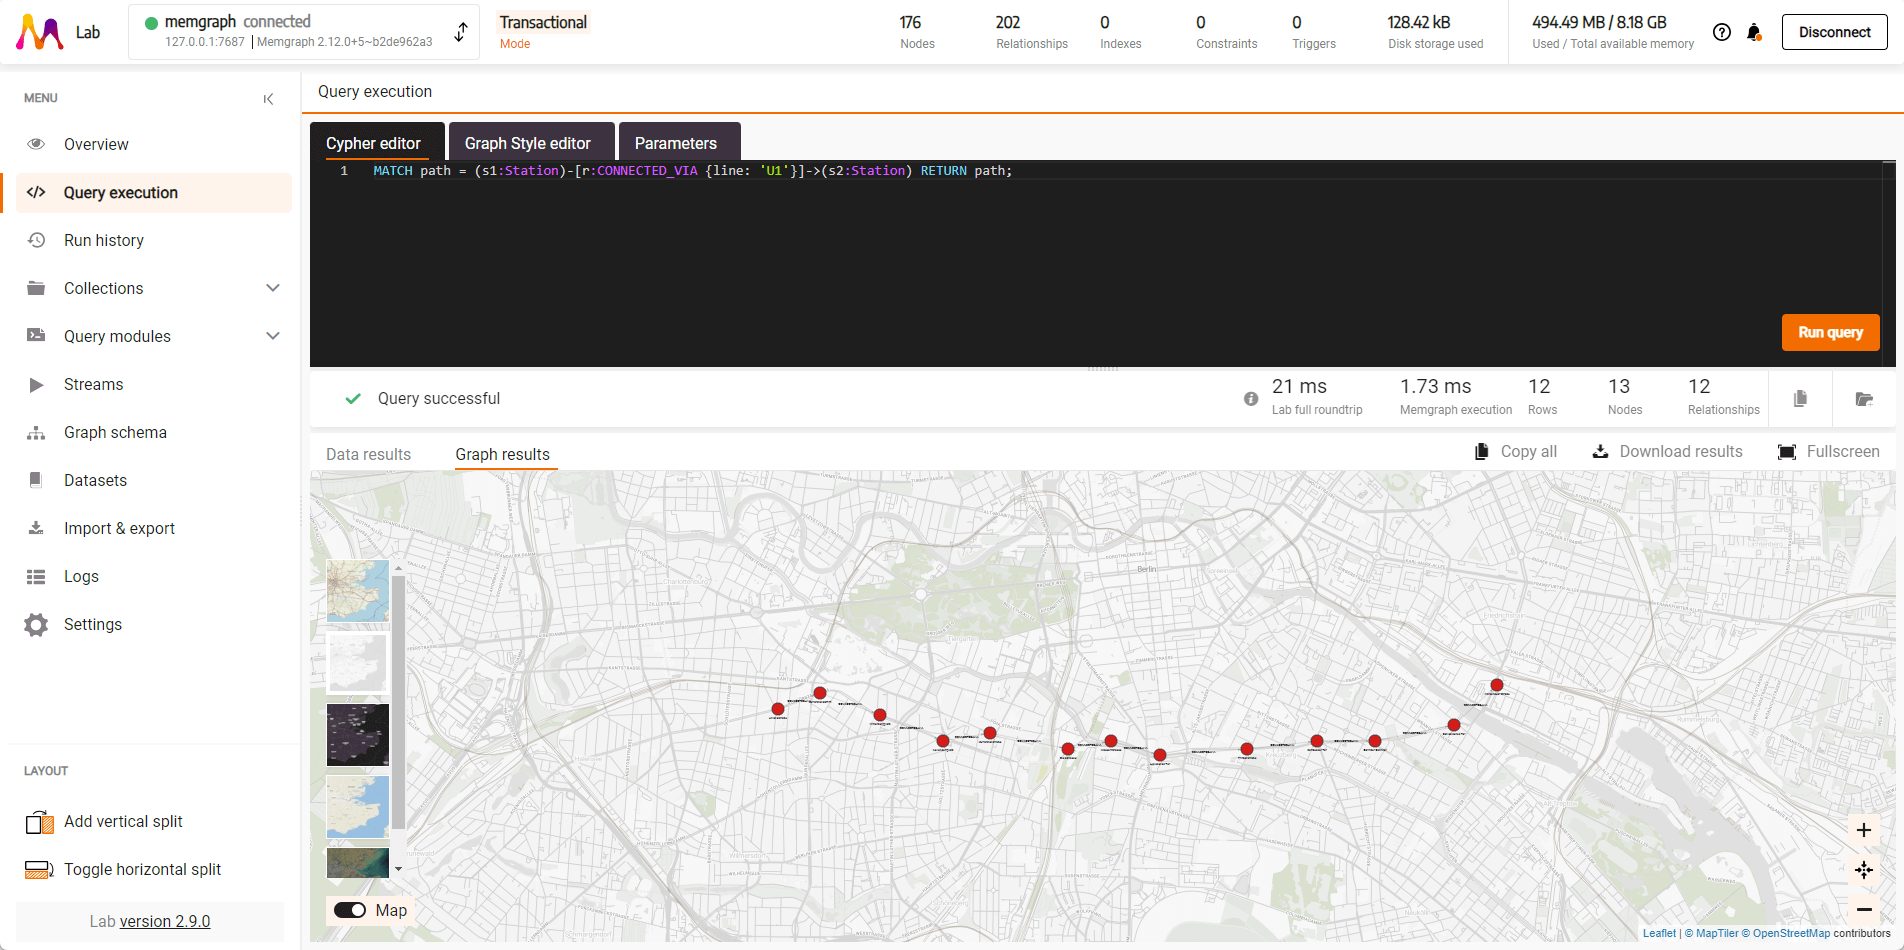
To see two lines (U1 and U6) at the same time:
MATCH path = (s1:Station)-[r1:CONNECTED_VIA {line: 'U1'}]->(s2:Station)
RETURN path
UNION
MATCH path = (s3:Station)-[r2:CONNECTED_VIA {line: 'U6'}]->(s4:Station)
RETURN path;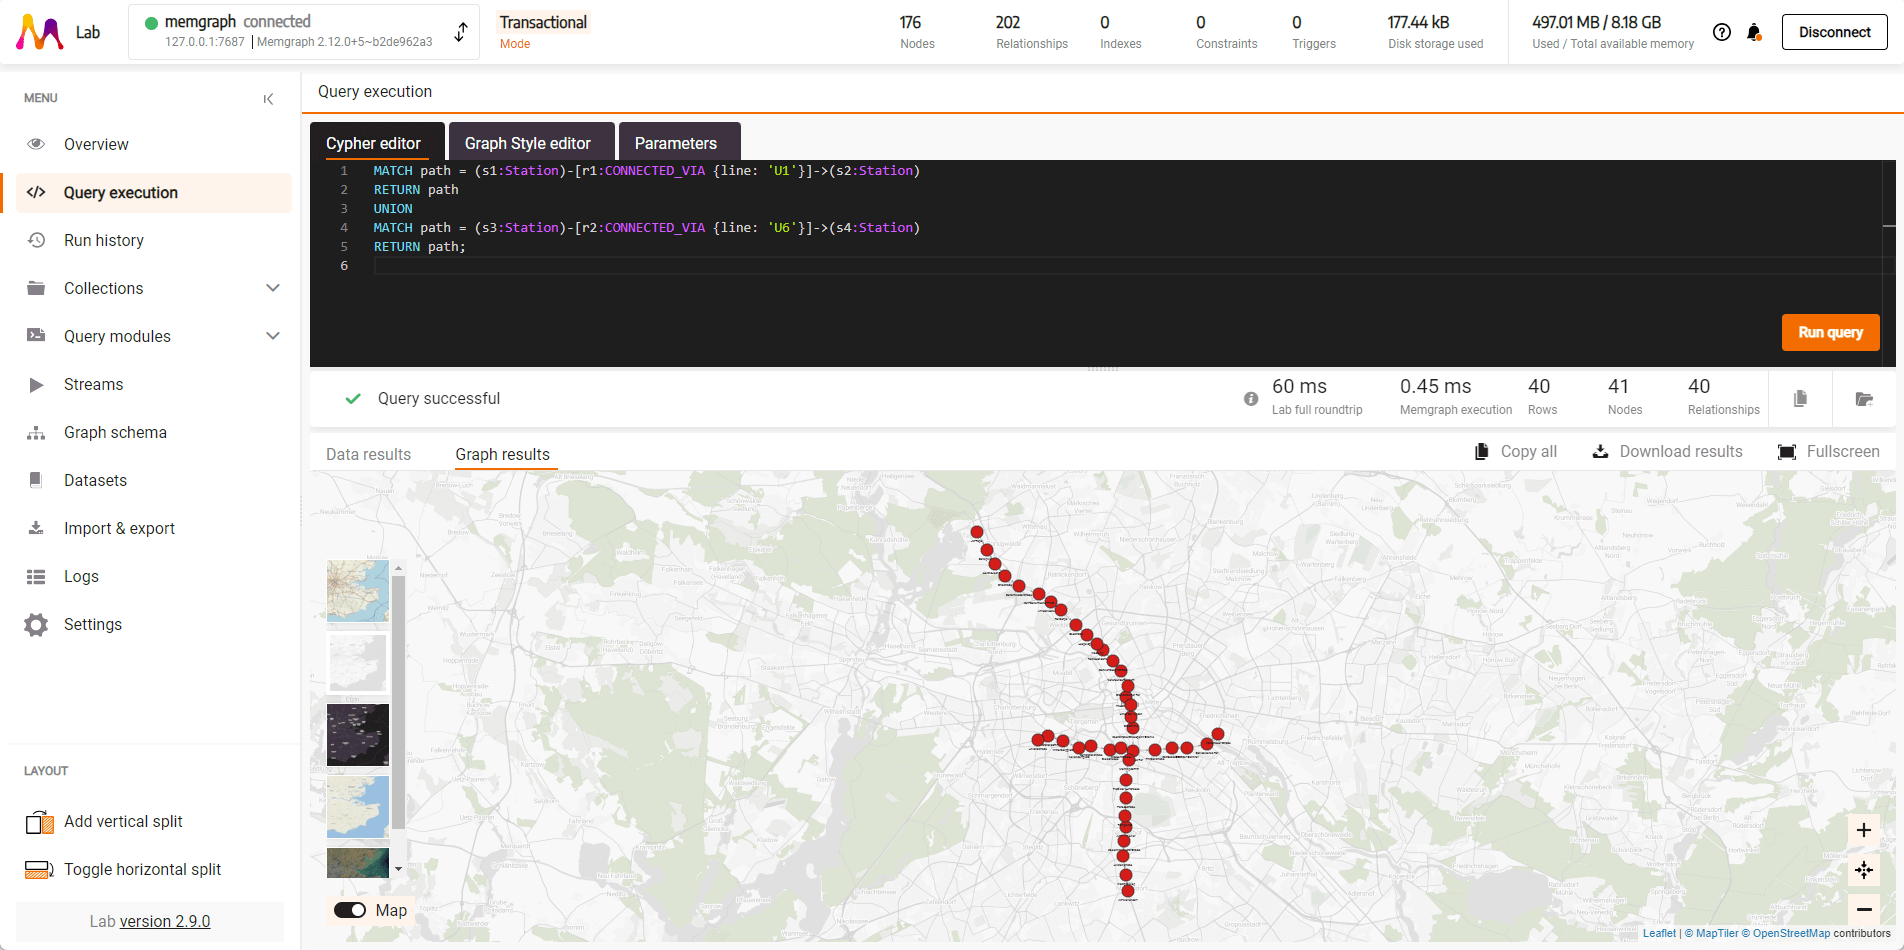
To find the shortest path between two stations using the Weighted Shortest Path algorithm:
MATCH path=(s1:Station {name: "Uhlandstraße"})-[:CONNECTED_VIA *WSHORTEST (r, n | r.time)]-(s2:Station {name: "Spittelmarkt"}) RETURN path;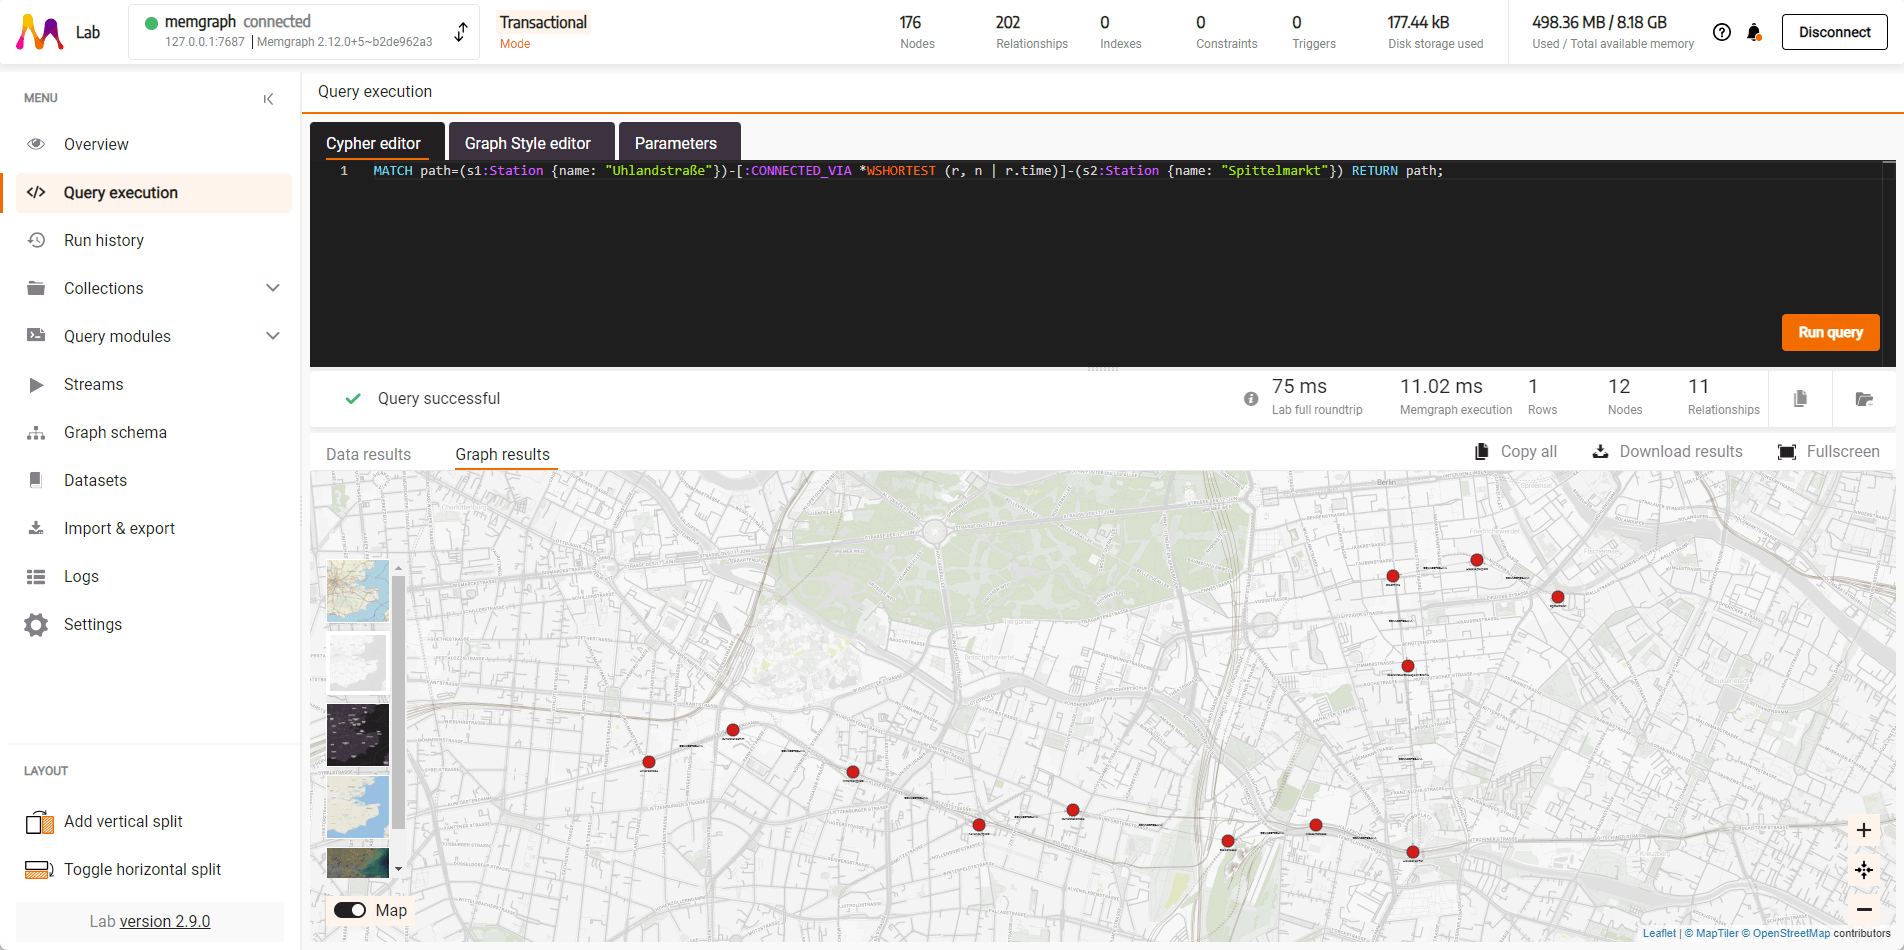
To see what stations are up to two hops away from Stadtmitte:
MATCH (stadtmitte {name: 'Stadtmitte'}), path=(stadtmitte)-[:CONNECTED_VIA*1..2]-(n:Station)
RETURN stadtmitte, n;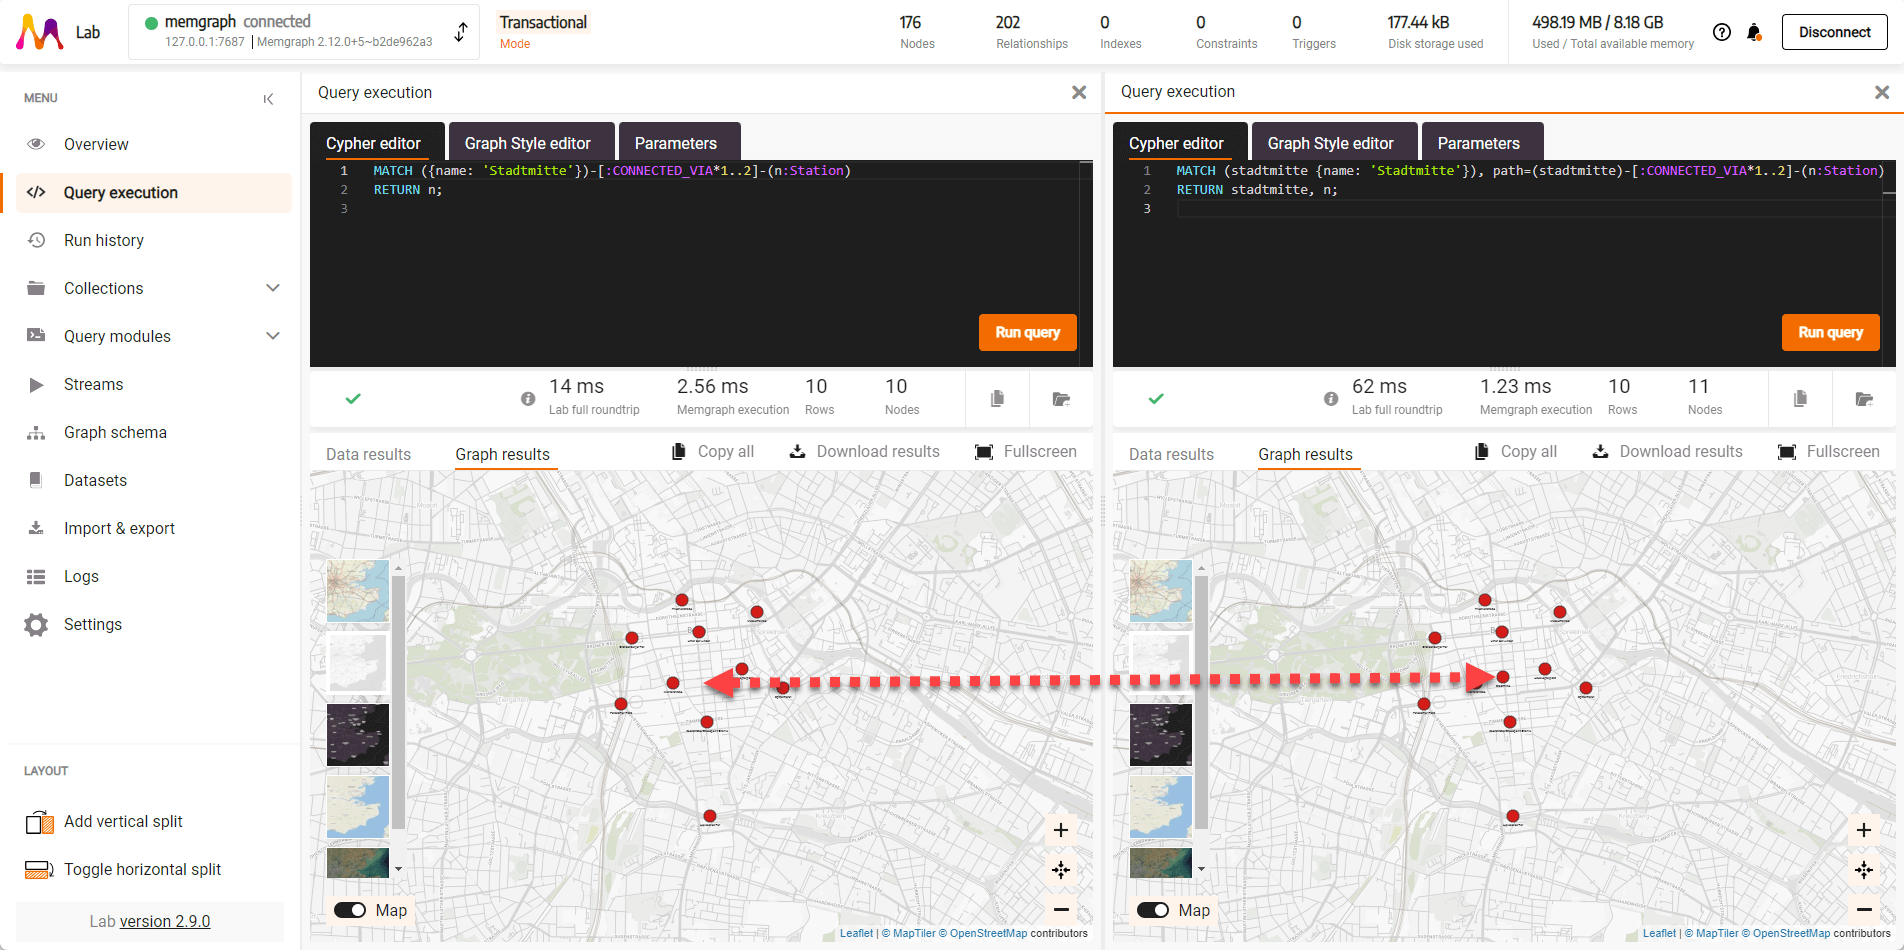
Styling Graphs
Add colors to the subway lines using the Graph Style Editor. First, define node styles:
@NodeStyle {
 border-color: #000000
 border-width: 1
 color: #aaaaaa
 color-hover: #aaaaaa
 color-selected: #aaaaaa
 size: 4
 font-size: 10
}

@NodeStyle Equals(Property(node, "end"), 1) {
 border-color: #000000
 border-width: 1
 color: #444444
 color-hover: #444444
 color-selected: #444444
 size: 6
 font-size: 14
}
Then add colors for each line based on official RAL color values from Wikipedia:
@EdgeStyle {
  label: Property(edge, "line")
  width: 4
  width-hover: 8
  arrow-size: 0
  font-size: 10
}

@EdgeStyle Equals(Property(edge, "line"), "U1") {
  color: #50C878
  color-hover: #50C878
  color-selected: #50C878
}

@EdgeStyle Equals(Property(edge, "line"), "U2") {
  color: #D84B20
  color-hover: #D84B20
  color-selected: #D84B20
}
Takeaway
You’ve learned how to import and visualize complex subway networks, run insightful queries, and style your results for maximum impact. These skills open up a world of possibilities for data analysis and visualization. The subway network of Berlin is just the beginning — there are endless networks and connections out there waiting to be discovered and understood.